
Website Speed Optimization: Free Tools to Make Your Site Lightning Fast
A client once asked: “Why is my bounce rate 75%? People leave within seconds!”
I ran Google PageSpeed Insights on their site. Score: 23/100. Load time: 8.4 seconds.
The brutal truth: 53% of mobile users abandon sites that take longer than 3 seconds to load. Their site took nearly 9 seconds. Three-quarters of their potential customers were gone before they even saw the content.
After optimization? Score: 94/100. Load time: 1.2 seconds. Bounce rate dropped to 32%. Conversions increased 156%.
The cost of the fix? Less than one lost customer would have paid.
Let me show you the free tools that reveal why your site is slow, and how to fix it—or when to call in professional help.
Why Website Speed Actually Matters (The Real Numbers)
Speed Kills Conversions
Research from Google, Amazon, and others shows brutal truths:
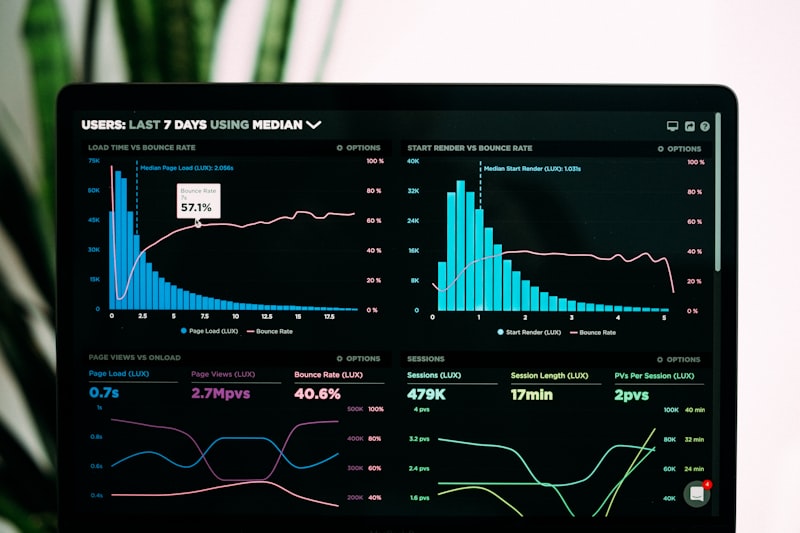
Load Time vs. Bounce Rate:
- 1-3 seconds: 32% probability of bounce
- 1-5 seconds: 90% probability of bounce
- 1-6 seconds: 106% probability of bounce
- 1-10 seconds: 123% probability of bounce
Amazon’s Discovery:
- Every 100ms delay = 1% decrease in sales
- For Amazon’s revenue, that’s $1.6 BILLION per year
Google’s Finding:
- 53% of mobile users abandon sites loading > 3 seconds
- Average mobile page takes 15.3 seconds to load
- Only 47% of users ever see your content

Speed Impacts SEO Rankings
Google officially uses speed as a ranking factor:
Core Web Vitals (Google’s metrics):
- Largest Contentful Paint (LCP) - Loading performance
- First Input Delay (FID) - Interactivity
- Cumulative Layout Shift (CLS) - Visual stability
Sites failing these metrics:
- Rank lower in search results
- Get less organic traffic
- Lose potential customers to faster competitors
The penalty compounds:
- Slow = Lower rankings = Less traffic = Fewer conversions
- Fast = Higher rankings = More traffic = More conversions
Speed Impacts User Experience
Real user behavior:
Slow site experience:
- Click search result
- Wait… wait… wait…
- “Ugh, this is taking forever”
- Hit back button
- Click competitor’s result
- That competitor gets the sale
Fast site experience:
- Click search result
- Page loads instantly
- “Wow, this is fast and professional”
- Browse products confidently
- Complete purchase
- You get the sale
Speed creates trust. Slow sites feel outdated, unprofessional, or even suspicious.
Google PageSpeed Insights: Your Free Speed Doctor
What It Does
Website: pagespeed.web.dev
Google PageSpeed Insights analyzes your website and gives you:
📊 Performance Scores (0-100):
- 90-100 = Excellent (green)
- 50-89 = Needs improvement (orange)
- 0-49 = Poor (red)
🔍 Core Web Vitals:
- Real user data from actual visitors
- Lab data from simulated loads
- Specific metrics for mobile and desktop
⚡ Actionable Recommendations:
- What’s slowing your site down
- How to fix each issue
- Priority order (biggest impact first)
- Estimated time savings for each fix
🔒 Security & Best Practices:
- HTTPS usage
- Vulnerable libraries
- Modern image formats
- Accessibility issues

How to Use PageSpeed Insights
Step 1: Go to pagespeed.web.dev
Step 2: Enter your website URL
Step 3: Click “Analyze”
Step 4: Wait 30-60 seconds
Step 5: Review results for both:
- Mobile (most important)
- Desktop
Understanding Your PageSpeed Score
What the numbers mean:
🟢 90-100: Excellent
→ Your site is fast
→ Minor optimizations possible
→ Keep monitoring for regressions

🟡 50-89: Needs Improvement
→ Users experiencing delays
→ Several optimization opportunities
→ Should prioritize fixes

🔴 0-49: Poor
→ Serious performance problems
→ Users are likely bouncing
→ Immediate action needed
Important: Mobile score matters MORE than desktop!
- 60%+ of traffic is mobile
- Mobile connections are slower
- Mobile devices have less power
- Google uses mobile-first indexing
Core Web Vitals Explained (In Plain English)
Google’s Core Web Vitals measure real user experience. Understanding these helps you prioritize fixes:
1. Largest Contentful Paint (LCP)
What it measures: How long until the main content appears
Good: < 2.5 seconds
Needs improvement: 2.5-4.0 seconds
Poor: > 4.0 seconds
Real-world meaning:
- User clicks your link
- How long until they see actual content (not just a white screen)?
Common causes of slow LCP:
- Large unoptimized images
- Slow server response time
- Render-blocking JavaScript and CSS
- Slow loading fonts
2. First Input Delay (FID) / Interaction to Next Paint (INP)
What it measures: How long until users can interact
Good (FID): < 100 milliseconds
Good (INP): < 200 milliseconds
Needs improvement: 100-300ms (FID), 200-500ms (INP)
Poor: > 300ms (FID), > 500ms (INP)
Real-world meaning:
- User clicks a button or link
- How long until something actually happens?
- Site “freezing” or feeling unresponsive
Common causes of slow INP/FID:
- Too much JavaScript
- Long tasks blocking the main thread
- Large bundles of code
- Unoptimized third-party scripts
3. Cumulative Layout Shift (CLS)
What it measures: Visual stability (things jumping around)
Good: < 0.1
Needs improvement: 0.1-0.25
Poor: > 0.25
Real-world meaning: You’re reading, about to click “Buy Now”…
- Image loads late, pushes everything down
- You accidentally click the wrong button
- Frustrating, unprofessional experience
Common causes of layout shift:
- Images without dimensions
- Ads/embeds without reserved space
- Web fonts causing text reflow
- Dynamic content loading above existing content
Common Performance Issues & How to Fix Them
PageSpeed Insights will show you specific problems. Here’s what they mean and how to fix them:
Issue 1: Huge Images
Problem:
⚠️ "Properly size images"
⚠️ "Defer offscreen images"
⚠️ "Serve images in next-gen formats"

Your 5MB photos are killing load times
Why it matters:
- Images typically = 50-80% of page weight
- Large images = slow loading
- Unoptimized images = wasted bandwidth
Solutions:
DIY Fixes:
-
Compress images before uploading
- Use TinyPNG.com or Squoosh.app
- Aim for < 200KB per image
-
Resize images to actual display size
- Don’t upload 4000px wide images to display at 800px
-
Use modern formats:
- WebP instead of JPEG (30% smaller)
- AVIF for even better compression
Professional Solutions:
- Cloudinary or Imgix (automatic optimization)
- Lazy loading implementation
- Responsive images (different sizes for different screens)
- CDN delivery
Issue 2: Render-Blocking Resources
Problem:
⚠️ "Eliminate render-blocking resources"
⚠️ "Reduce unused CSS"
⚠️ "Reduce unused JavaScript"

CSS and JS files blocking page rendering
Why it matters:
- Browser loads CSS/JS before showing content
- Visitors see blank page while files load
- Every second = lost visitors
Solutions:
DIY Fixes:
-
Defer non-critical JavaScript
<script src="script.js" defer></script> -
Inline critical CSS
- Put essential styles in
<head> - Load full stylesheet asynchronously
- Put essential styles in
-
Remove unused code
- Delete unused plugins
- Remove old CSS/JS files
Professional Solutions:
- Code splitting (load only what’s needed)
- Critical CSS extraction
- Webpack optimization
- HTTP/2 push

Issue 3: Slow Server Response
Problem:
⚠️ "Reduce server response time (TTFB)"

Server takes 2.4s to respond
Why it matters:
- Everything waits for server response
- Slow server = slow site, period
- Can’t be fixed client-side
Solutions:
DIY Fixes:
-
Upgrade hosting
- Shared hosting → VPS → Dedicated
- Geographic location closer to users
-
Enable caching
- WordPress: WP Super Cache or W3 Total Cache
- Browser caching
- Server-side caching
-
Use a CDN
- Cloudflare (free tier available)
- Distributes content globally
Professional Solutions:
- Database optimization
- Query optimization
- Server configuration tuning
- Advanced caching strategies
- Load balancing for high traffic
Issue 4: Too Much Third-Party Code
Problem:
⚠️ "Reduce the impact of third-party code"

45 third-party scripts adding 3.2s load time
Why it matters:
- Each third-party script slows your site
- Google Analytics, Facebook Pixel, chat widgets, etc.
- You don’t control their performance
Common culprits:
- Social media embed codes
- Multiple analytics tools
- Chat widgets (Intercom, Drift, etc.)
- Ad networks
- Font loading from Google Fonts
Solutions:
DIY Fixes:
-
Audit what you actually need
- Remove unused tracking codes
- Disable unnecessary widgets
-
Load third-party code asynchronously
- Prevents blocking main content
-
Self-host when possible
- Google Fonts → self-hosted fonts
Professional Solutions:
- Tag Manager implementation
- Lazy load third-party scripts
- Custom lightweight alternatives
- Server-side analytics
Issue 5: Missing Modern Optimization
Problem:
⚠️ "Enable text compression"
⚠️ "Minify CSS/JavaScript"
⚠️ "Use HTTP/2"

Basic optimizations not enabled
Solutions:
Server-level fixes:
- Enable GZIP or Brotli compression
- Minify all CSS and JavaScript
- Enable HTTP/2 (or HTTP/3)
- Set proper cache headers
Most modern hosts enable these by default, but older sites might not have them.
Other Essential Speed Testing Tools
GTmetrix
Website: gtmetrix.com
What it offers:
- Detailed waterfall chart (see exactly what loads and when)
- Video playback of page loading
- Historical comparisons
- Multiple test locations
- Export detailed reports
Best for: Deep-dive technical analysis
WebPageTest
Website: webpagetest.org
What it offers:
- Test from multiple locations worldwide
- Different browsers and devices
- Connection speed throttling (simulate 3G)
- Film strip view of loading
- Super detailed metrics
Best for: Advanced performance testing
Chrome DevTools (Built-in)
How to access:
- Right-click on page
- Select “Inspect”
- Go to “Performance” tab
What it offers:
- Real-time performance monitoring
- Network waterfall
- JavaScript profiling
- Paint timing
- Memory usage
Best for: Developer-level debugging
Your Monthly Speed Check Routine
Set a calendar reminder for the 1st of each month:
Website Owner Monthly Checklist (15 minutes)
1. Run PageSpeed Insights
   → Check mobile score
   → Check desktop score
   → Note any new warnings

2. Check Core Web Vitals in Search Console
   → Any pages failing?
   → Trends improving or declining?

3. Review GTmetrix report
   → Waterfall chart for bottlenecks
   → Compare to last month

4. Test actual load time
   → Visit your site on mobile
   → Visit on slow connection
   → How does it feel?

5. Update plugins/themes
   → Outdated code = security + performance issues

6. Review and remove:
   → Unused plugins
   → Unused themes
   → Old media files
   → Unnecessary scripts
Why monthly?
- Performance degrades over time
- New content adds weight
- Plugins get slower with updates
- Early detection prevents disasters
Real-World Case Studies
Case Study 1: E-commerce Store
Before Optimization:
- PageSpeed Score: 32/100 (mobile)
- Load Time: 7.2 seconds
- Bounce Rate: 68%
- Conversion Rate: 1.2%
Issues Found:
- Unoptimized product images (5MB each)
- 23 unused plugins active
- No caching enabled
- Render-blocking CSS/JS
After Optimization:
- PageSpeed Score: 92/100 (mobile)
- Load Time: 1.8 seconds
- Bounce Rate: 35%
- Conversion Rate: 3.8%
Business Impact:
- 216% increase in conversions
- Revenue increased from $12K/month to $38K/month
- ROI of optimization: 1,900% in first month
Cost: $2,500 one-time optimization

Case Study 2: Local Service Business
Before:
- PageSpeed Score: 45/100
- Load Time: 5.1 seconds
- Google Ranking: Page 2-3
- Monthly leads: 15
Issues:
- Huge hero images
- Slow WordPress hosting
- No mobile optimization
After:
- PageSpeed Score: 95/100
- Load Time: 1.3 seconds
- Google Ranking: Top 5
- Monthly leads: 47
Business Impact:
- 213% increase in leads
- Better Google rankings
- More calls and form submissions
- Faster ROI from marketing spend
Cost: $1,800 optimization + hosting upgrade ($25/month)
Case Study 3: Blog/Content Site
Before:
- PageSpeed Score: 28/100
- Load Time: 9.4 seconds (!)
- Pages per session: 1.2
- Time on site: 24 seconds
Issues:
- Unoptimized images everywhere
- 50+ plugins (!!)
- Shared hosting overwhelmed
- No CDN
After:
- PageSpeed Score: 94/100
- Load Time: 1.1 seconds
- Pages per session: 3.8
- Time on site: 4 minutes 12 seconds
Business Impact:
- 217% increase in engagement
- Ad revenue tripled
- Google traffic increased 340%
- Site actually usable on mobile
Cost: $1,200 optimization + CDN ($20/month)
When You Can DIY vs. When to Hire Help
You Can Probably DIY If:
✅ Your PageSpeed score is 70+
- Just needs minor tweaks
✅ Issues are mainly:
- Image sizes/compression
- Unused plugins
- Basic caching
✅ You have time to:
- Learn the basics
- Test changes carefully
- Implement gradually
✅ Your site uses:
- WordPress with standard plugins
- Common e-commerce platforms
- Website builders (Wix, Squarespace)
You Should Hire Help If:
⚠️ Your PageSpeed score is < 50
- Significant structural issues
- Requires expert knowledge
⚠️ Issues include:
- Render-blocking resources
- Server response time problems
- Complex JavaScript issues
- Database optimization needed
⚠️ You have:
- Custom-coded website
- High traffic (100K+ visits/month)
- E-commerce with many products
- Critical business dependence
⚠️ You need:
- Results quickly (days, not months)
- Guaranteed improvements
- Ongoing monitoring
- Focus on your business, not tech

Professional Website Speed Optimization Services
I specialize in taking slow websites and making them lightning fast. Here’s how I can help:
Complete Speed Optimization Package
What’s included:
1. Comprehensive Audit
- PageSpeed Insights analysis
- GTmetrix detailed report
- WebPageTest multi-location testing
- Core Web Vitals assessment
- Competitive benchmarking
2. Technical Optimization
- Image compression and optimization
- Code minification and bundling
- Render-blocking resource elimination
- Browser caching configuration
- GZIP/Brotli compression
- Database optimization (WordPress/WooCommerce)
- Lazy loading implementation
- Critical CSS extraction
3. Infrastructure Improvements
- CDN setup and configuration
- Hosting evaluation and recommendations
- Server optimization
- HTTP/2 or HTTP/3 enablement
- Security headers
4. Ongoing Monitoring
- Monthly speed reports
- Core Web Vitals tracking
- Regression alerts
- Continuous optimization
Typical Results:
- 40-70% faster load times
- PageSpeed scores 80-95+
- Improved Google rankings
- Reduced bounce rates
- Increased conversions
Timeline: 1-2 weeks for most sites
Investment: $1,500-$4,000 depending on complexity
Emergency Speed Fix
For sites in crisis:
- Same-day or next-day turnaround
- Focus on biggest bottlenecks first
- Quick wins for immediate improvement
- Get you to “good enough” FAST
Timeline: 24-48 hours
Investment: $800-$1,500
Monthly Speed Maintenance
Prevent performance regression:
- Monthly PageSpeed audits
- Ongoing optimization tweaks
- Plugin/theme updates with testing
- Image optimization for new content
- Performance monitoring
- Priority support
Investment: $200-$500/month
WordPress Performance Overhaul
Specialized for WordPress:
- Plugin audit and cleanup
- Theme optimization
- Database cleanup and optimization
- WooCommerce specific optimization
- WordPress-specific caching setup
- PHP and MySQL tuning
Perfect for:
- WooCommerce stores
- Membership sites
- High-traffic blogs
- Multi-site networks
The Optimization Process (What to Expect)
If you hire me for optimization, here’s exactly what happens:
Week 1: Analysis
Days 1-2:
- Initial audit with all tools
- Identify all performance bottlenecks
- Prioritize fixes by impact
- Create detailed optimization plan
Day 3:
- Present findings and recommendations
- Discuss timeline and approach
- Get your approval to proceed
Week 2: Implementation
Days 4-7:
- Implement technical optimizations
- Server and hosting improvements
- CDN setup if needed
- Database optimization
Days 8-10:
- Testing on multiple devices
- Verify Core Web Vitals improvement
- Check for any broken functionality
- Fine-tune remaining issues
Week 2-3: Delivery
Days 11-12:
- Final testing and verification
- Documentation of all changes
- Training on maintaining speed
- Handoff and monitoring setup
Day 13-14:
- Monitor for any issues
- Make final adjustments
- Deliver final performance report
Ongoing
- Monthly check-ins
- Performance monitoring
- Help with new content optimization
- Support as needed
Speed Optimization ROI Calculator
Use this to estimate the value of optimization:
Your Current Situation
Monthly visitors: 10,000
Current conversion rate: 2%
Average order value: $100
Current monthly revenue: $20,000

Load time: 6 seconds
Estimated bounce rate: 65%
After Optimization (Conservative Estimates)
Load time improved to: 1.5 seconds
Bounce rate drops to: 35%
Conversion rate improves by: 50% (to 3%)

New monthly revenue: $30,000
Increase: $10,000/month

Investment in optimization: $2,500
ROI in month 1: 300%
ROI in year 1: 4,700%
Even a 1-second improvement can yield massive returns.
Quick Speed Wins (Do These Today)
If you want to improve speed immediately, do these:
1. Compress Your Images (10 minutes)
- Go to TinyPNG.com
- Upload your largest images
- Download compressed versions
- Replace originals on your site
Expected improvement: 20-40% faster
2. Enable Caching (5 minutes)
WordPress:
- Install WP Super Cache or W3 Total Cache
- Enable caching
- Test your site
Other platforms:
- Check your hosting control panel
- Look for “caching” or “speed” settings
- Enable any caching options
Expected improvement: 30-50% faster
3. Sign Up for Cloudflare (15 minutes)
- Go to Cloudflare.com
- Create free account
- Add your site
- Update your nameservers
- Enable “Auto Minify” and “Rocket Loader”
Expected improvement: 25-45% faster
Total time: 30 minutes
Total cost: $0
Total improvement: 50-80% faster (often)
Conclusion: Speed Is Not Optional
In 2026, a slow website is a dead website:
📉 Slow = Lower rankings
📉 Slow = Higher bounce rates
📉 Slow = Fewer conversions
📉 Slow = Lost revenue
But speed optimization isn’t just about numbers on a screen. It’s about:
✅ User experience - Respecting your visitors’ time
✅ Professionalism - Fast sites feel trustworthy
✅ Accessibility - Fast sites work on all devices
✅ Revenue - Fast sites convert better
✅ SEO - Google rewards fast sites
The good news: You have free tools to diagnose problems:
⚡ Google PageSpeed Insights - Your starting point
📊 GTmetrix - Detailed analysis
🔬 WebPageTest - Advanced testing
The better news: Most speed issues are fixable.
The question: Will you fix them yourself, or hire someone to do it right the first time?
Ready to Make Your Site Lightning Fast?
If your PageSpeed score is under 70, you’re losing customers right now. Every day you wait costs you money.
I can help:
✅ Free initial speed audit - See exactly what’s slowing you down
✅ Honest assessment - I’ll tell you if you can DIY or need help
✅ Fast turnaround - Most sites optimized in 1-2 weeks
✅ Guaranteed improvement - Get to 80+ or your money back
✅ Ongoing support - Don’t let speed regress
Most common results:
- 50-70% faster load times
- PageSpeed scores improve 30-60 points
- Bounce rates drop 20-40%
- Conversions increase 30-150%
Contact me for a free speed audit and let’s discuss how to make your site competitive.
Remember: Your competitors are optimizing their sites. Every day you don’t optimize is a day they’re winning.
Let’s make your site fast. ⚡
When was the last time you checked your PageSpeed score? Do it now—it takes 30 seconds and might be the most valuable 30 seconds of your week.